Table of contents
Affinity Diagrams
Pareto Diagrams
Table of contents |
Ishikawa or Fishbone diagrams | HOME |
back to
Affinity Diagrams |
go on to
Pareto Diagrams |
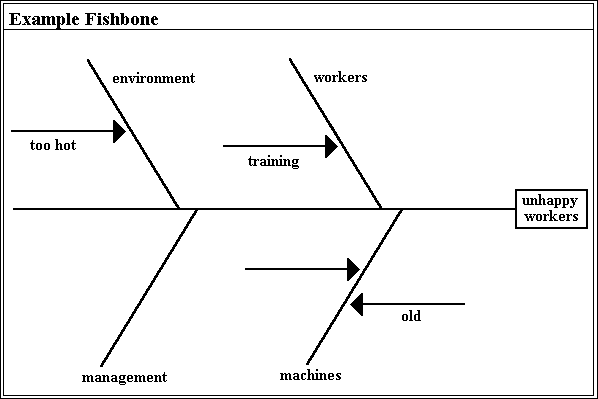
Ishikawa Diagram The figure below shows an Ishikawa diagram. Note that this tool is referred to by several different names: Ishikawa diagram, Cause and Effect diagram, Fishbone and Root Cause Analysis. These names all refer to the same tool. The first name is after the inventor of the tool - K. Ishikawa (1969) who first used the technique in the 1960s. Cause and Effect also aptly describes the tool, since the tool is used to capture the causes of a particular effect and the relationships between cause and effect. The term fishbone is used to describe the look of the diagram on paper. The basic use of the tool is to find root causes of problems; hence, this last name.

Consider this figure. The basic concept in the fishbone diagram is that the name of a basic problem is entered at the right of the diagram at the end of the main 'bone.' This is the problem of interest. At an angle to this main bone are located typically three to six sub-bones which are the contributing general causes to the problem under consideration. Associated with each of the sub-bones are the causes which are responsible for the problem designated. This subdivision into ever increasing specificity continues as long as the problem areas can be further subdivided. The practical maximum depth of this tree is usually about four or five levels. When the fishbone is complete, one has a rather complete picture of all the possibilities about what could be the root cause for the designated problem.
The fishbone diagram can be used by individuals or teams; probably most effectively by a group. A typical utilization is the drawing of a fishbone diagram on a blackboard by a team leader who first asserts the main problem and asks for assistance from the group to determine the main causes which are subsequently drawn on the board as the main bones of the diagram. The team assists by making suggestions and, eventually, the entire cause and effect diagram is filled out. Once the entire fishbone is complete, team discussion takes place to decide what are the most likely root causes of the problem. These causes are circled to indicate items that should be acted upon, and the use of the fishbone tool is complete.
The Ishikawa diagram, like most quality tools, is a visualization and knowledge organization tool. Simply collecting the ideas of a group in a systematic way facilitates the understanding and ultimate diagnosis of the problem. Several computer tools have been created for assisting in creating Ishikawa diagrams. A tool created by the Japanese Union of Scientists and Engineers (JUSE) provides a rather rigid tool with a limited number of bones. Other similar tools can be created using various commercial tools. One example of creating a fishbone diagram is shown in an upcoming chapter.
Only one tool has been created that adds computer analysis to the fishbone. Bourne et al. (1991) reported using Dempster-Shafer theory (Shafer and Logan, 1987) to systematically organize the beliefs about the various causes that contribute to the main problem. Based on the idea that the main problem has a total belief of one, each remaining bone has a belief assigned to it based on several factors; these include the history of problems of a given bone, events and their causal relationship to the bone, and the belief of the user of the tool about the likelihood that any particular bone is the cause of the problem.
Definition: A graphic tool used to explore and display opinion about sources of variation in a process. (Also called a Cause and Effect Chart or Fishbone Diagram.)
Purpose: To clearly illustrate the various sources of variation affecting a given KQC by sorting and relation the sources to the effect.
How to Construct:
Table of contents |
Ishikawa or Fishbone diagrams | HOME |
back to
Affinity Diagrams |
go on to
Pareto Diagrams |